 Mira Okafor
Projects / Tidemark
Tidemark
A small dashboard that shows river levels and flood risk from cheap sensors, and says how sure it is.
- Role
- Lead engineer
- Year
- 2026
- Status
- In use
- Built with
- Go, SQLite, Hugo
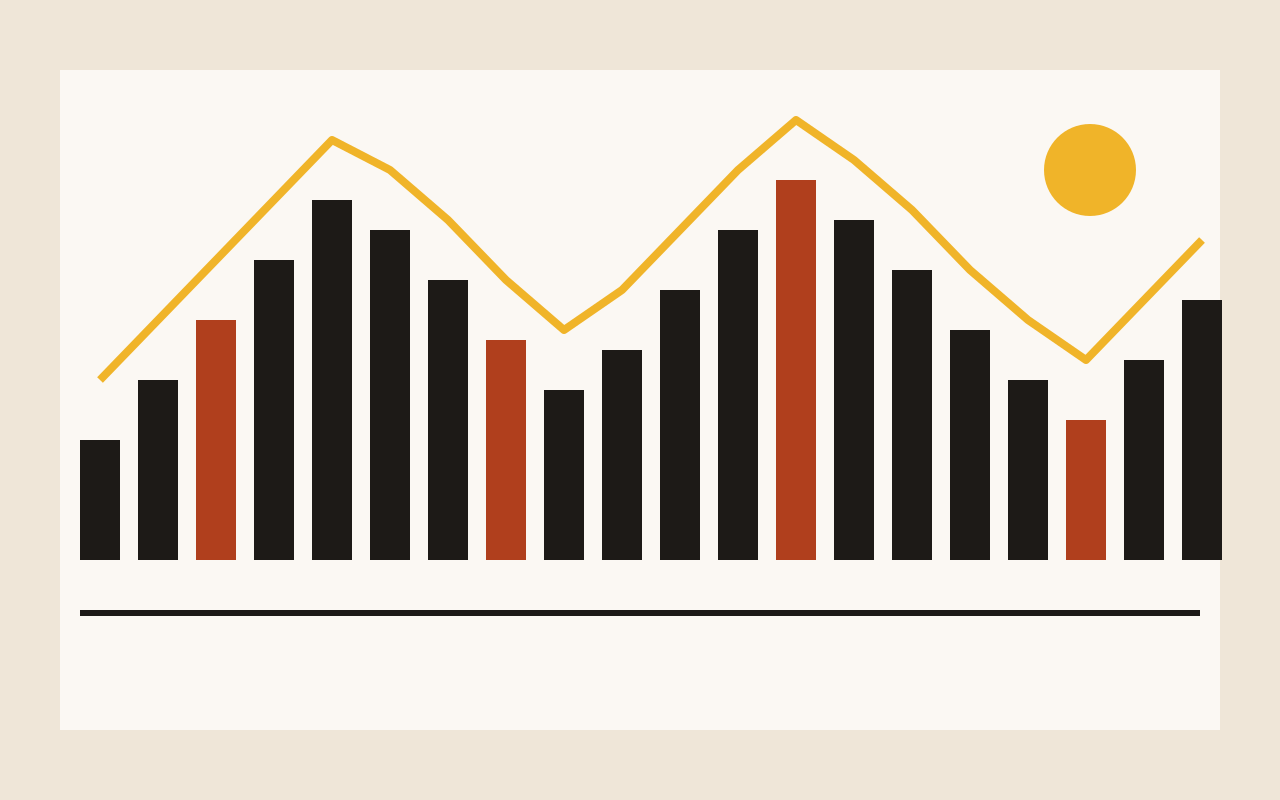
Tidemark started when a neighbourhood group asked a simple question: is the stream behind the school about to flood? They had six cheap sensors and a spreadsheet. They did not have a way to tell a real rise from a bad reading.
What it does#
It takes readings from low-cost sensors, compares each one with its neighbours and shows the level with a range, not a single number. When a sensor drifts, the range widens and the page says so.
How it was built#
The collector is a single Go program that writes to SQLite. The pages are static and rebuilt every ten minutes, so the dashboard stays up even when the collector does not.
What I learned#
People trust a number more when it admits doubt. The first version showed one bold figure and users kept phoning to ask if it was right. The second showed the range, and the calls stopped.